For the first part of this article, to learn about Park Factors, OPS+, and FIP-, click here.
Digging into the park factors, other than Penn State, there were no large changes that caused a park to go from a pitcher’s park to a hitter’s park and vice versa. They went from a 97 park factor(slight pitcher’s park) to a 116 park factor(hitter-friendly). Nebraska is no longer the most hitter-friendly park and Purdue remains as an extreme pitcher’s park with a 63 park factor rating.

There are seven teams who have a pitcher-friendly park and six teams who have a hitter-friendly park in the Big Ten. Just an FYI, the Big Ten Tournament will be played at Indiana’s home park, Bart Kaufman Stadium, which is a pitcher-friendly park.
Now that park factors are out of the way, let’s get into OPS+, and weighted on base average, better known as wOBA.
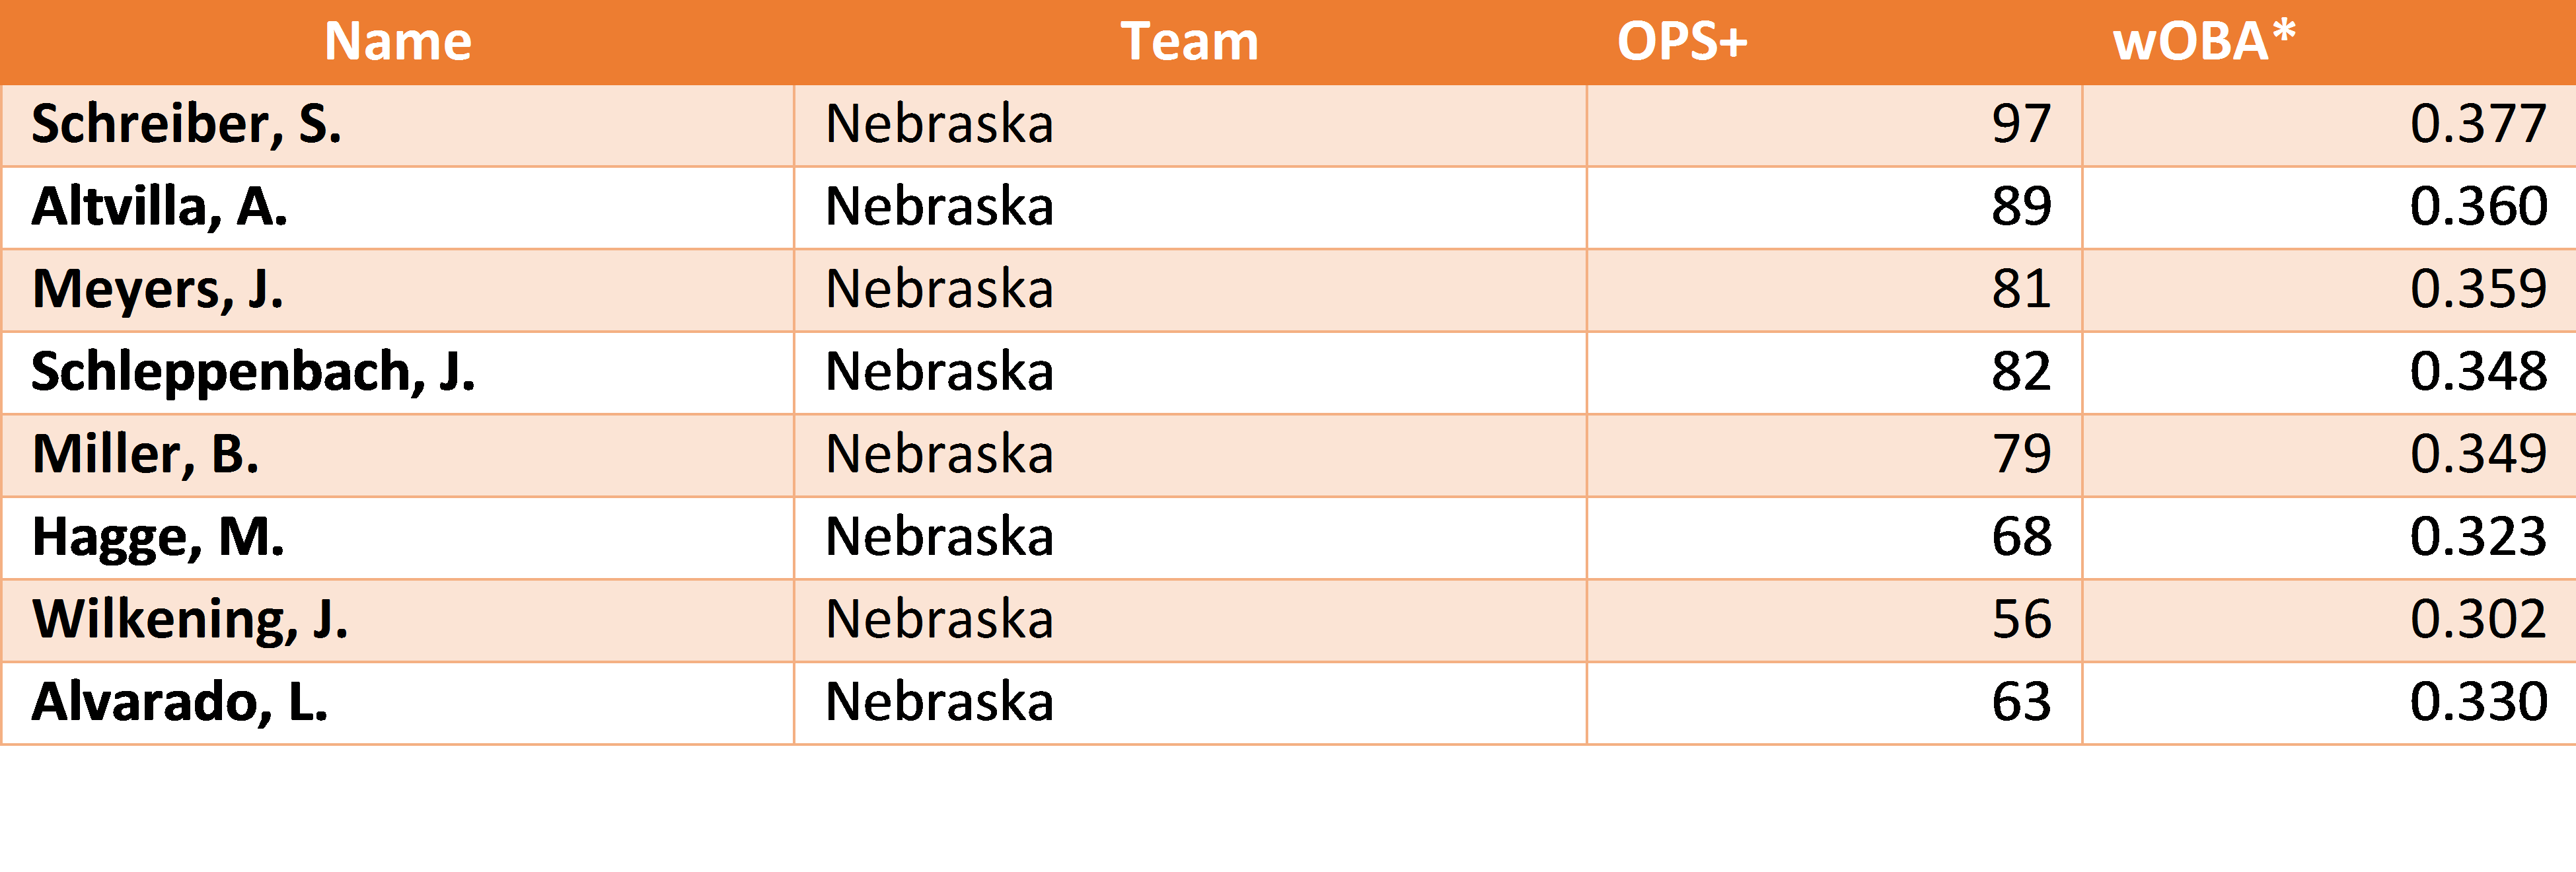
According to FanGraphs, “Weighted On-Base Average (wOBA) is one of the most important and popular catch-all offensive statistics. It was created by Tom Tango (and notably used in “The Book”) to measure a hitter’s overall offensive value, based on the relative values of each distinct offensive event.” I am a big fan of Tom Tango and his work, and had the honor to hear some of his work at the SABR Analytics Conference in March. I recommend reading The Book, as I enjoy the wOBA statistic, because it adds a precise value to each event, like walks, hit by pitches, singles, doubles, triples and home runs. wOBA also does a good job of projecting future performance. Thanks to Jeff Zimmerman at Fangraphs, we are able to have a formula for wOBA, although it is not the most precise. The run values are a general estimation over many years in the MLB, but we are talking college baseball. I wanted to use the general formula just to have a number out there for stat nerds and college baseball fans to see. So, here is the basic formula for wOBA that I used: Basic wOBA = (.7* (BB + HBP) + .9*1B + 1.25*2B + 1.6*3B + 2*HR)/PA. Each event has a run value attributed to it. For example, a walk or hit by pitch is worth .7 runs. Now that’s the explanation part, get ready for graphs of each team in the Big Ten, displaying their OPS+ and wOBA. The league average wOBA is .344 in the Big Ten. To qualify for this list, a player must have at least three plate appearances per game played. For example, Iowa played 53 games in the regular season, which means to qualify for this list, an Iowa batter must have accrued at least 159 plate appearances. League average OPS+ is 100, anything above is above average, anything below is below average.


Here is an example calculation for wOBA. Jake Adams walked 27 times and was hit by 5 pitches, while tallying 35 singles, 14 doubles, and 24 home runs in 246 plate appearances. Plug in the numbers to each event, (.7* (27 + 5) + .9*35 + 1.25*14 + 1.6*0 + 2*24)/246 and it comes out to a .482 weighted on base average.
There were a few questions as to how these numbers make sense. Like, why does a nationally ranked team like Michigan have such poor hitting per OPS+? Or why does Purdue have so many outstanding hitters per OPS+, although their record does not show it? The first reason explains why I added wOBA, to measure how good an overall offensive player is minus the park adjustment. The second reason is the park adjustment, a hitter that plays for Purdue and slugs .500 is more valuable than a hitter that plays for Michigan and slugs the same amount due to Purdue being a pitcher’s park and Michigan a hitter’s park. On the flip side, pitching will be affected conversely. Michigan pitching is more valuable than Purdue pitching in terms of park adjustments.
Here are the Top 5 hitters in the Big Ten by each statistic:
The Top 5 Big Ten hitters according to wOBA:
- Jake Adams, Iowa .485
- Pat McInerney, Illinois .429
- Matt Lloyd, Indiana .426
- Jack Yalowitz, Illinois .423
- Marty Costes, Maryland .420
The Top 5 Big Ten hitters according to OPS+:
- Jake Adams, Iowa 206
- Evan Warden, Purdue 182
- Matt Lloyd, Indiana 180
- Bryce Bonner, Purdue 175
- Jacson McGowan, Purdue 172
In short, Jake Adams is REALLY good. As OPS+ states, he is 106% better than league average and nearly has a .500 wOBA, which is unremarkable! Jakey is going places, that’s for sure.
Moving on to the pitching. Like hitting, I added in another statistic to go along with FIP-. ERA-, which is a given player’s earned run average, adjusted for his team’s park factor. The ERA- calculation is just like the FIP-, except by replacing the FIP to ERA. The formula: 100*((ERA+(ERA-ERA(Park Factor/100))/lgERA. The league ERA is 4.19. To be qualified for ERA- and FIP-, a pitcher must pitch at least one inning per team game played. Ohio State played 56 games this season, so for an Ohio State pitcher to be qualified for the calculation, he must have pitched at least 56 during the season.
Here are the ERA- and FIP- calculations for each team. League FIP is 4.22 and league ERA is 4.19. Both FIP- and ERA- league average is 100. Anything below is above league average, anything above is below league average.


Take Nick Gallagher, for example. He posted a 2.59 ERA. Plug it into the equation, with a 95 park factor and the 4.19 lgERA, 100*((2.59+(2.59-2.59(95/100))/4.19 which comes out to be 65, 35 percent better than league average.
What I like about having both FIP- and ERA- together is how much a defense/luck factors to the pitcher’s performance. FIP measures a pitcher’s three true outcomes, walks/hit by pitches, strikeouts, and home runs. Combining FIP with ERA allows to determine whether a pitcher was lucky or unlucky based upon the three true outcomes. A pitcher with a higher FIP- than ERA- is considered lucky and vice versa. Here are some examples of lucky pitchers:
- Walter Borkovich, Michigan State
- FIP-: 98
- ERA-: 56
- Cal Krueger, Indiana
- FIP-: 102
- ERA-: 69
- Lucas Gilbreath, Minnesota
- FIP-:86
- ERA-: 60
Some examples of unlucky pitchers (FIP- lower than ERA-):
- Cole Bellair, Illinois
- FIP-: 138
- ERA-: 171
- Ryan Feltner, Ohio State
- FIP-: 99
- ERA-: 145
- Justin Hagenman, Penn State
- FIP-: 92
- ERA-: 117
Now, the Top 5 pitchers in FIP- and ERA-:
FIP-:
- Alec Rennard, Michigan 49
- Michael Hendrickson, Michigan 54
- Oliver Jaskie, Michigan 55
- Sal Biasi, Penn State 63
- Matt Waldron, Nebraska 64
ERA-:
- Brian Shaffer, Maryland 43
- Walter Borkovich, Michigan State 56
- Oliver Jaskie, Michigan 58
- Lucas Gilbreath, Minnesota 60
- Derek Burkamper, Nebraska 60
The three guys atop the FIP- leaderboard are all from Michigan, because each player posted a FIP under 3.30 and played in the most hitter-friendly park in the Big Ten. A notable pitcher to look out for is Brian Shaffer of the Maryland Terrapins. He ranked 6th in the FIP- leaderboard and is 1st in the ERA- leaderboard.
With the Big Ten Tournament ahead of us, fans can have a better understanding of how well a pitcher or batter does compared to the rest of their league. Jake Adams is the top hitter in the Big Ten and Brian Shaffer is one of the top pitchers in the Big Ten. Lucky for us, they will more than likely square off on Wednesday at 12:30 PM CDT as 4th seeded Maryland takes on 5th seeded Iowa.


