
NCAA Baseball can have sabermetrics, too.
The “sabermetric revolution”, or the application of using objective methodology to determine and understand player performances, is swirling all around Major League Baseball. Statistics such as On-Base Plus Slugging Plus(OPS+) for hitters and Fielding Independent Pitching Minus(FIP-) with pitchers, among many more sabermetrics. All these unique stats determining player performance are great ways to understand the game of baseball from a unique perspective. The MLB and everyone working with it/alongside it make these stats easily available. I thought to myself, why not do some digging and research to have these metrics present in NCAA Baseball, specifically the Big Ten and the Iowa Hawkeyes? I am proud to introduce OPS+ and FIP- to the Big Ten Conference, but before I do that I must talk about the metric that is involved with all of the other metrics, the park factor.
A park factor is a measure of how much a given ballpark contributes to the production of a player or team. The formula indicates the difference between runs scored in a team’s home and road games. It goes such as this: (Runs Scored by the Home Team+ Runs Allowed by the Home Team)/(Runs Scored by same team in away games+ Runs Allowed in away games)*100. An average park is scaled to 100. A park below 100 is a pitcher-friendly park. A park above 100 is a hitter-friendly park. I’ve done the park factors for each team through the past weekend in the Big Ten. 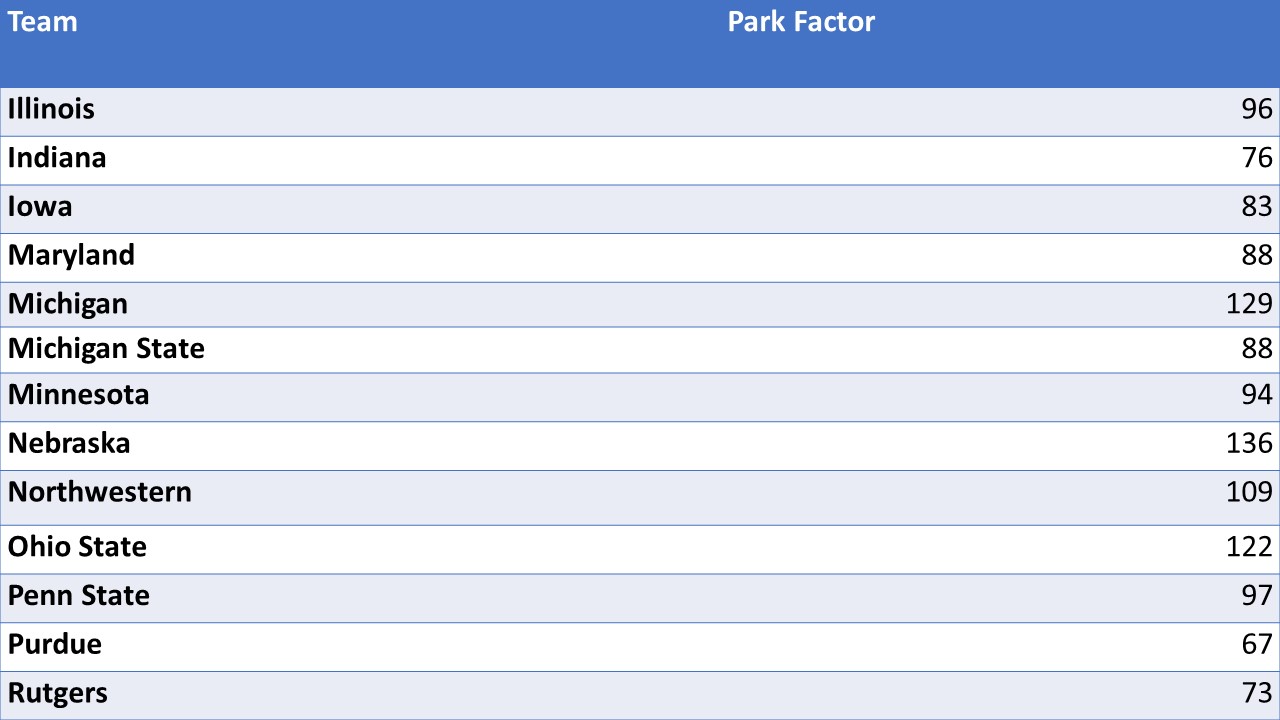 So, a team like Iowa has a pitcher-friendly park. They scored 90 runs and allowed 56 runs in 15 games at Duane Banks field, while scoring 138 runs and allowing 135 runs in 23 games on the road. Multiply that by 100 and those numbers come up with a park factor of 83.
Alright, on to the fun stuff.
On Base Plus Slugging Plus(OPS+): OPS+, according to MLB.com, is on-base percentage(OBP)(how many times a player gets on base) plus slugging percentage(SLG)(total bases by a given player divided by their at-bats) and normalizes the number across the entire league, while accounting for ballpark factors. It adjusts to a score of 100, which is considered league-average. An OPS+ over 100 is above league average, while below 100 is below league average. The formula goes as follows: 100 * ( OBP/lgOBP + SLG/lgSLG – 1)/Park Factor. The lgOBP and lgSLG is the league average On-Base Percentage and Slugging Percentage for qualified hitters. A qualified hitter is a player who averages at least 3 Plate Appearances per team game played. The lgOBP for the Big Ten(through April 23) is .365 and the lgSLG(through April 23) is .417. Here are the results for the Top 5 hitters in the Big Ten based upon OPS+:
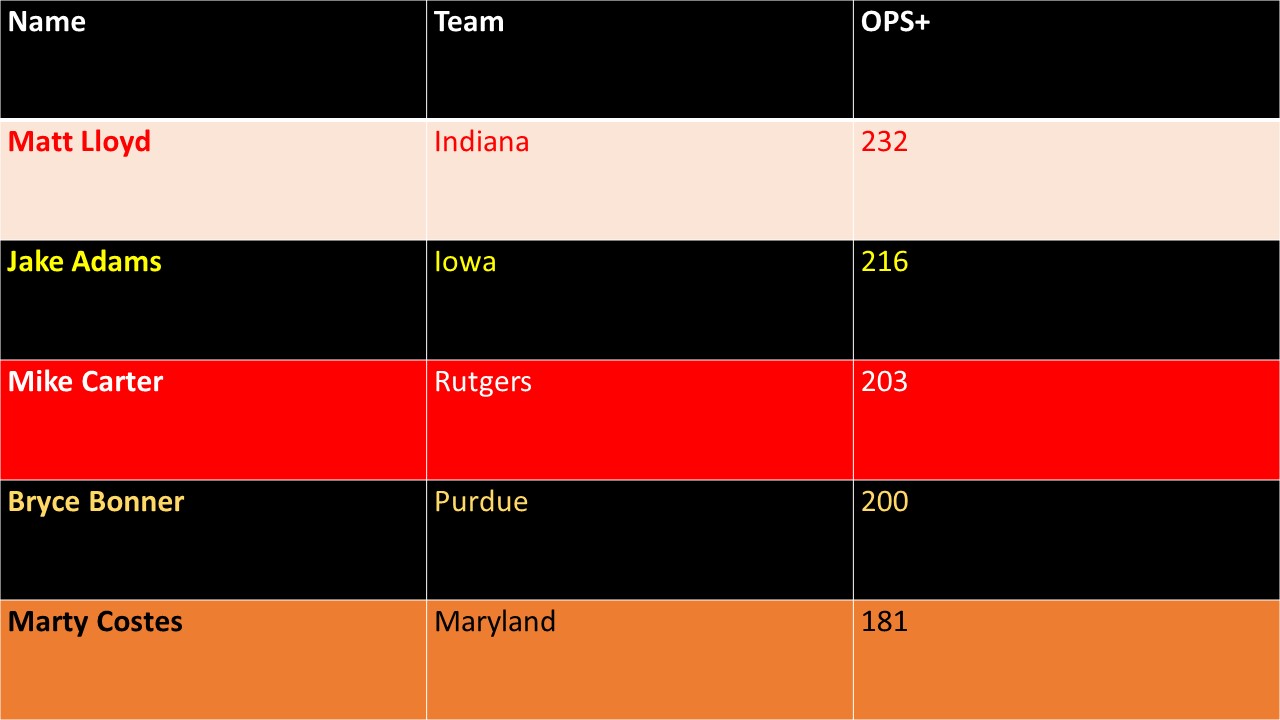
Take Iowa’s Jake Adams who currently has posted a 216 OPS+, which is 116% better than league average. Yes, that is possible. Matt Lloyd is the league-leader because he hits well in a pitcher-friendly environment, as Indiana’s park factor, as previously mentioned, is 76 to go with a .434 on base percentage and a .655 slugging percentage.
Fielding Independent Pitching Minus(FIP-): Fielding Independent Pitching is similar to ERA, but it focuses on a pitcher’s three true outcomes: strikeouts, walks/hit by pitches, and home runs. The formula for FIP: ((13*HR)+(3*(BB+HBP))-(2*K))/IP + constant. The constant came out to be 3.73, but is subject to change until the season concludes. Then we take FIP and put it in another formula to determine how well a pitcher does compared to his league, adjusting for park. The formula goes as follows: 100*((FIP+(FIP-FIP(Park Factor/100))/lgFIP, where the lgFIP is the league average FIP based upon qualified pitchers who have thrown at least 1 inning per team game played. The league average FIP is 4.52. Unlike OPS+, FIP- is designed to have a lower score, so the lower the number is, the better a pitcher is compared to league average. A number above 100 is considered below league average. Here are the top 5 pitchers according to FIP-: 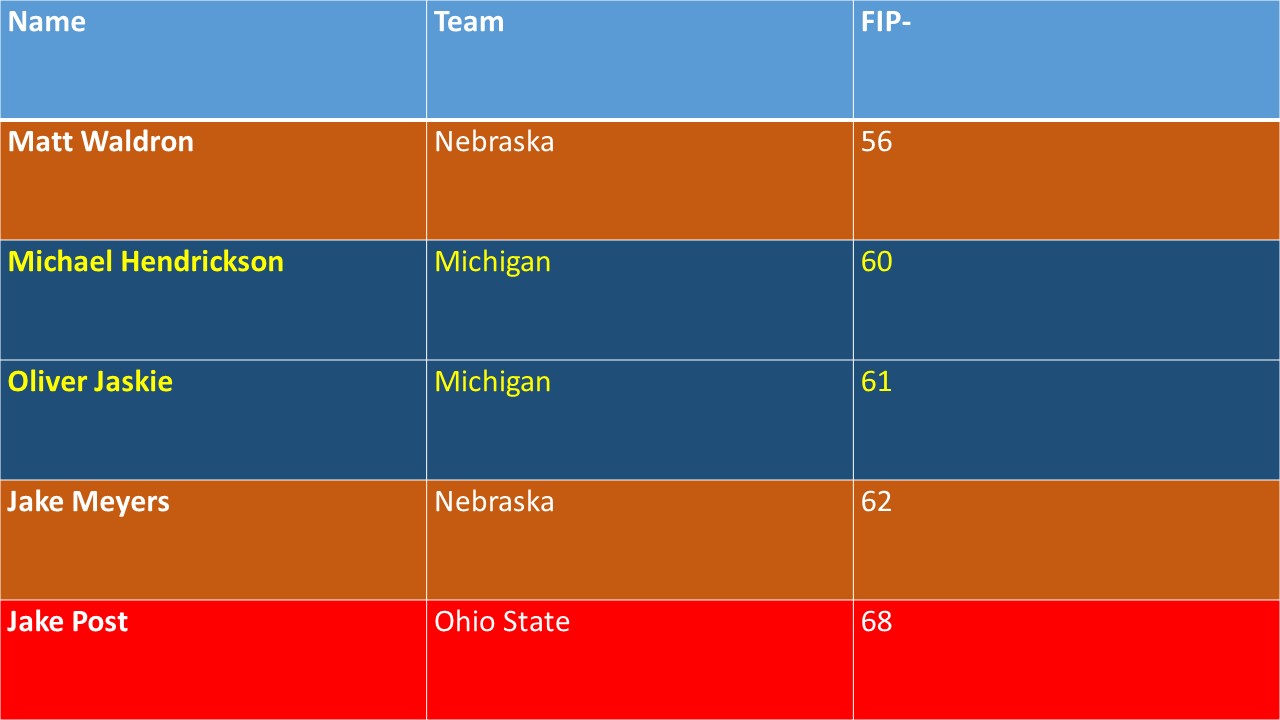
According to the data, Nebraska’s Matt Waldron is the best pitcher in the Big Ten according to FIP-, 44% better than league average. The reasoning behind his success is his high strikeout-to-walk ratio. So far, he has 33 strikeouts and has only walked 8 batters, hit 4 batters, and gave up 3 home runs in a hitter-friendly park, with a park factor of 136.
There will be a full update on these statistics once the season concludes.