


Here’s a test. I’ll describe the state of the economy, and you tell me if I’m talking about 2006 or 2018.
Following years of historically low interest rates, the Fed has steadily raised rates over the past few years. These rate increases reflect tight labor markets, healthy economic growth and inflation replacing deflation as the Fed’s primary concern. Tax cuts and increased spending have supplied a fiscal boost but swollen the balance on the world’s largest credit card.
For their part, borrowers have gorged on cheap, abundant credit, and lenders are so flush with funds they seem willing to lend to anyone. The credit cycle is hitting a fever pitch. Regardless, these loans will be bundled together and sold to investors who are too starved for yield to be bothered with due diligence.
Okay, time’s up. Pencils down. The answer is C, all of the above. The description applies to both 2006 and 2018. Let’s sort out the analogs.
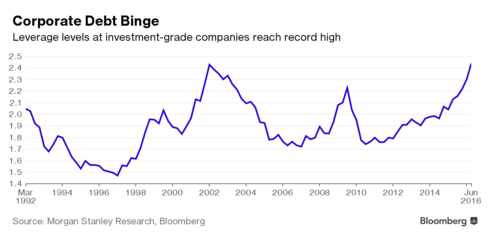
Commercial (i.e. corporate) credit is to 2018 as mortgage credit was to 2006. U.S. corporations have issued record amounts of debt every year since 2012, borrowing an additional $1.67 trillion in 2017. Much of that borrowing has financed record dividends and stock buybacks, cashing out the firms’ equity and levering up their balance sheets. Remember when homeowners treated their houses like ATMs? Shareholder payouts are on pace to surpass $1 trillion for the first time in 2018. These are the cash-out refis of yesteryear.
CLOs are to 2018 as CDOs were to 2006. Quick profits attract new entrants, and there are 50% more CLO managers today than a year ago. Collectively, the CLO machines churned out $37.8 billion of product in the first quarter of 2018, a record pace and 118% more than the same period in 2017.
U.S. courts recently waived risk retention rules, meaning CLO managers need not retain any of the CLOs they sell. Bonus question: What happens to the quality of CLOs when managers no longer have skin in the game?
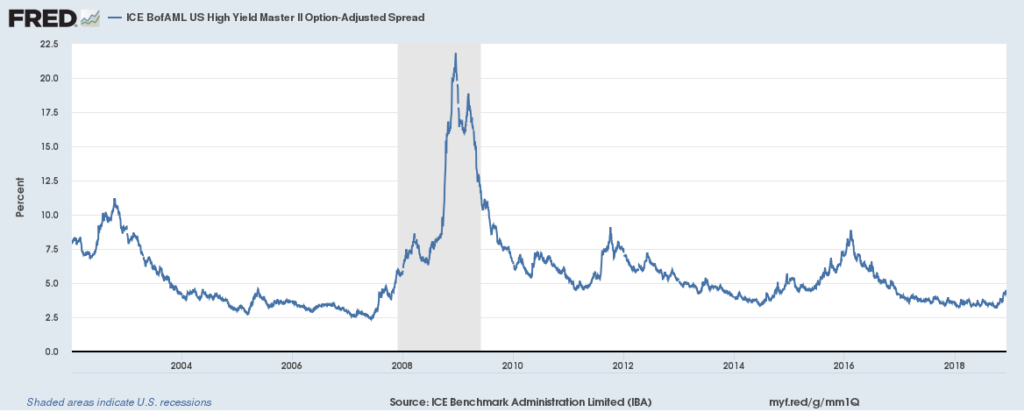
Junk debt is to 2018 as subprime debt was to 2006. Of the $7.5 trillion U.S. corporate debt market, only a third can comfortably be considered investment grade. Another third falls into the BBB category, just one ratings downgrade away from junk status.
The BBB category attracts investors who want to take more risk but are only authorized to buy investment grade debt. Bonds in this regulatory sweet spot have doubled to $2.5 trillion over the last five years, now comprising half of the entire investment grade bond market. Such clustering at a key ratings threshold suggests the system is being gamed. Sound familiar?

Leveraged loans cater to smaller and riskier corporate borrowers, and they provide the raw materials fueling the CLO boom. These corporate loans have nearly doubled since 2006 and now account for over $1 trillion of the U.S. corporate debt market.
To sustain such growth, lending standards have fallen to record lows based on Moody’s covenant-quality indicator. A staggering 80% of leveraged loans issued in the first quarter of 2018 were “covenant-lite” compared with just 23% in 2012. Are CLO investors incorporating larger losses on defaults in their valuation models, or are they blindly extrapolating past data that don’t reflect the current environment?
As with foreclosures, default rates will stay low as long as debts continue to be refinanced. But once you roll a seven, you are forced to give up the dice. Warren Buffett has observed, “It’s only when the tide goes out that you see who was swimming naked.” Here’s hoping the skinny dippers aren’t as crucial to the system as they were in 2006.
Stay tuned in with KRUI
Programming features, updates, special events, and more delivered right to you